vnevermore
Member
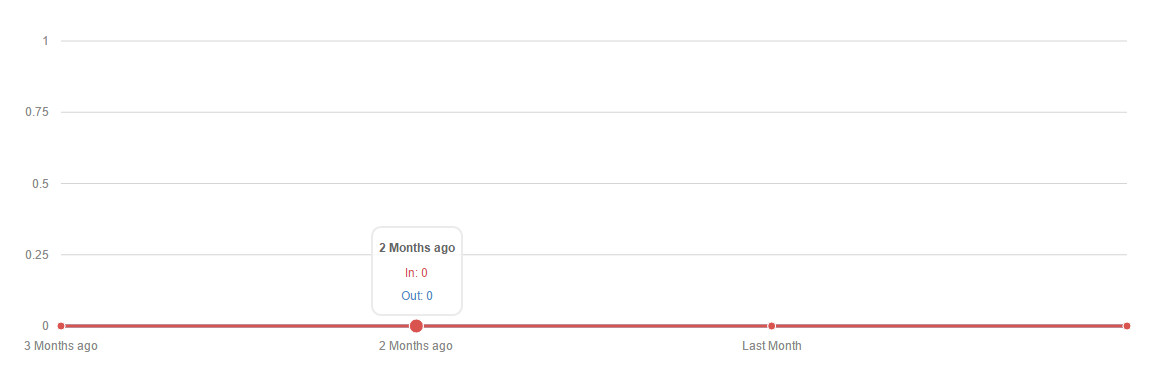
Can someone please explain me what this chart shows?
http://prntscr.com/d63akm
http://prntscr.com/d63ap2
I consider that it is related with the visitors/clicks of the website that is submitted by the user but what this".." means? right?
As i can see, there are a few vars that are replaced
Maybe it should be instead of ".." something like "2 months ago" and "3 months ago"
Also what if a user have submitted 2 websites using the existing feature?
There will be chart only for the first submitted website
http://prntscr.com/d63akm
http://prntscr.com/d63ap2
I consider that it is related with the visitors/clicks of the website that is submitted by the user but what this".." means? right?
As i can see, there are a few vars that are replaced
Code:
        var data = google.visualization.arrayToDataTable([
          ['', '{$lng->g_out}', '{$lng->g_in}'],
          ['{$lng->g_this_month}',  {$tot_out_0_monthly},      {$tot_in_0_monthly}],
          ['{$lng->g_last_month}',  {$tot_out_1_monthly},      {$tot_in_1_monthly}],
          ['..',  {$tot_out_2_monthly},      {$tot_in_2_monthly}],
          ['..',  {$tot_out_3_monthly},      {$tot_in_3_monthly}]
]);Also what if a user have submitted 2 websites using the existing feature?
There will be chart only for the first submitted website
")